The editor
One window with dockable panels, a command palette that finds everything, and a workspace for each kind of work. Press F1 over any panel to open its page in this manual.
The main window
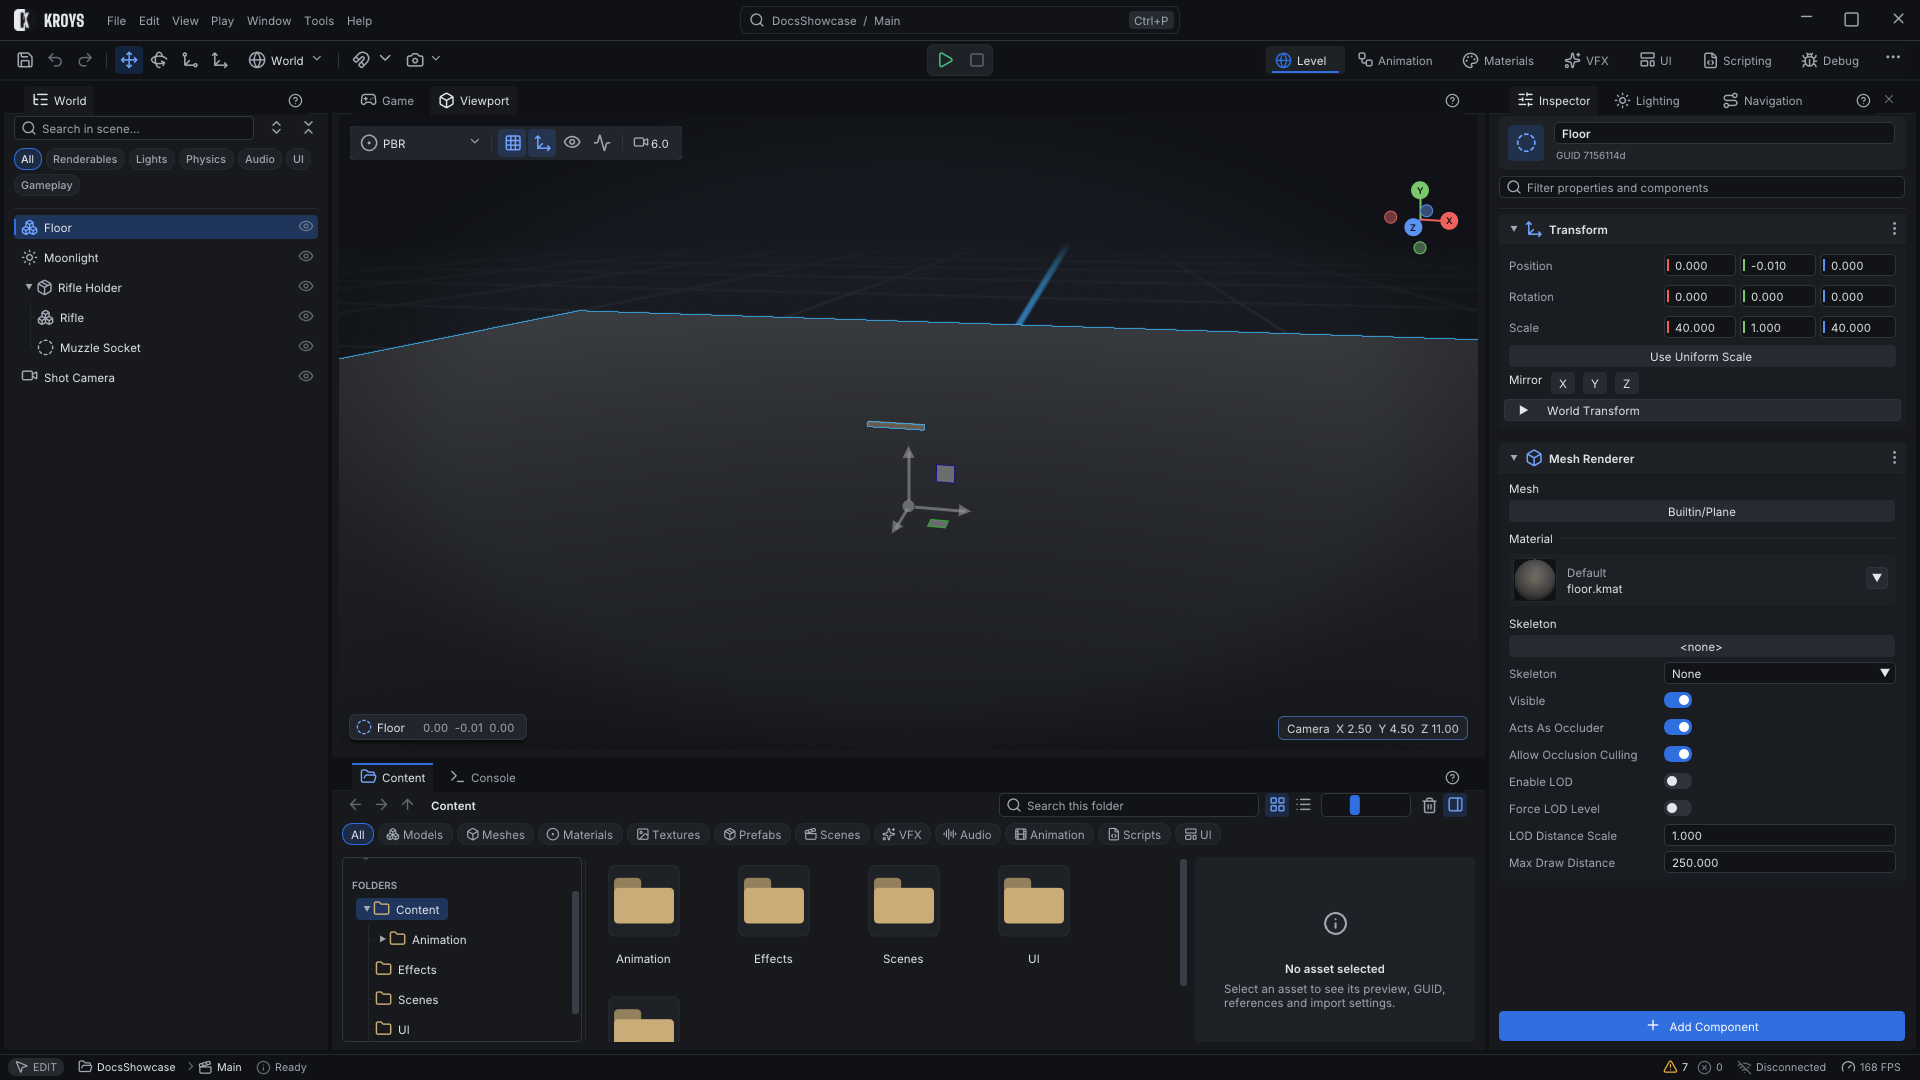
The top bar holds the menus, the project and scene name, and the search field. Under it, the toolbar has the transform tools, Play and Stop, and the workspace tabs. The rest of the window is a dock space: drag a panel's tab to move it, or out of the window to float it.
| Panel | What it is for |
|---|---|
| Viewport | The scene in 3D: select, move, rotate and scale entities, drop assets. |
| Game | The game as the player sees it, running in Play mode. |
| World | The scene's entities as a tree; drag to re-parent. |
| Inspector | The selected entity's components or the selected asset's settings. |
| Content | The project's Content folder: assets, folders, previews. |
| Console | Log messages, script errors (click to open the file), warnings. |
Toolbar
Save, undo and redo on the left, then the transform tools (move, rotate, scale, universal) with the transform space, snapping and the camera menu. Play and Stop sit in the middle; the workspace tabs are on the right.
Status bar
The status bar at the bottom shows the mode (EDIT or PLAY), the project and scene, the latest message, warning and error counts, the network state and the frame rate.
Find anything
- Ctrl+P Go to Anything: assets, entities, panels and commands in one list, matched as you type.
- Ctrl+Shift+P Command Palette: every editor command with its shortcut.
- Help › Keyboard Shortcuts lists every shortcut and lets you change them.
Tooltips on buttons name the command and its shortcut, so the palette and the shortcuts teach each other.
Panels and their help
Every panel has a small ? button in its title bar, and F1 with the mouse over a panel opens that panel's page of this manual. The Help menu opens the manual, the API references, the samples and what changed in this version. The documentation is part of the engine: it opens from your disk, without a network connection.
Diagnostics
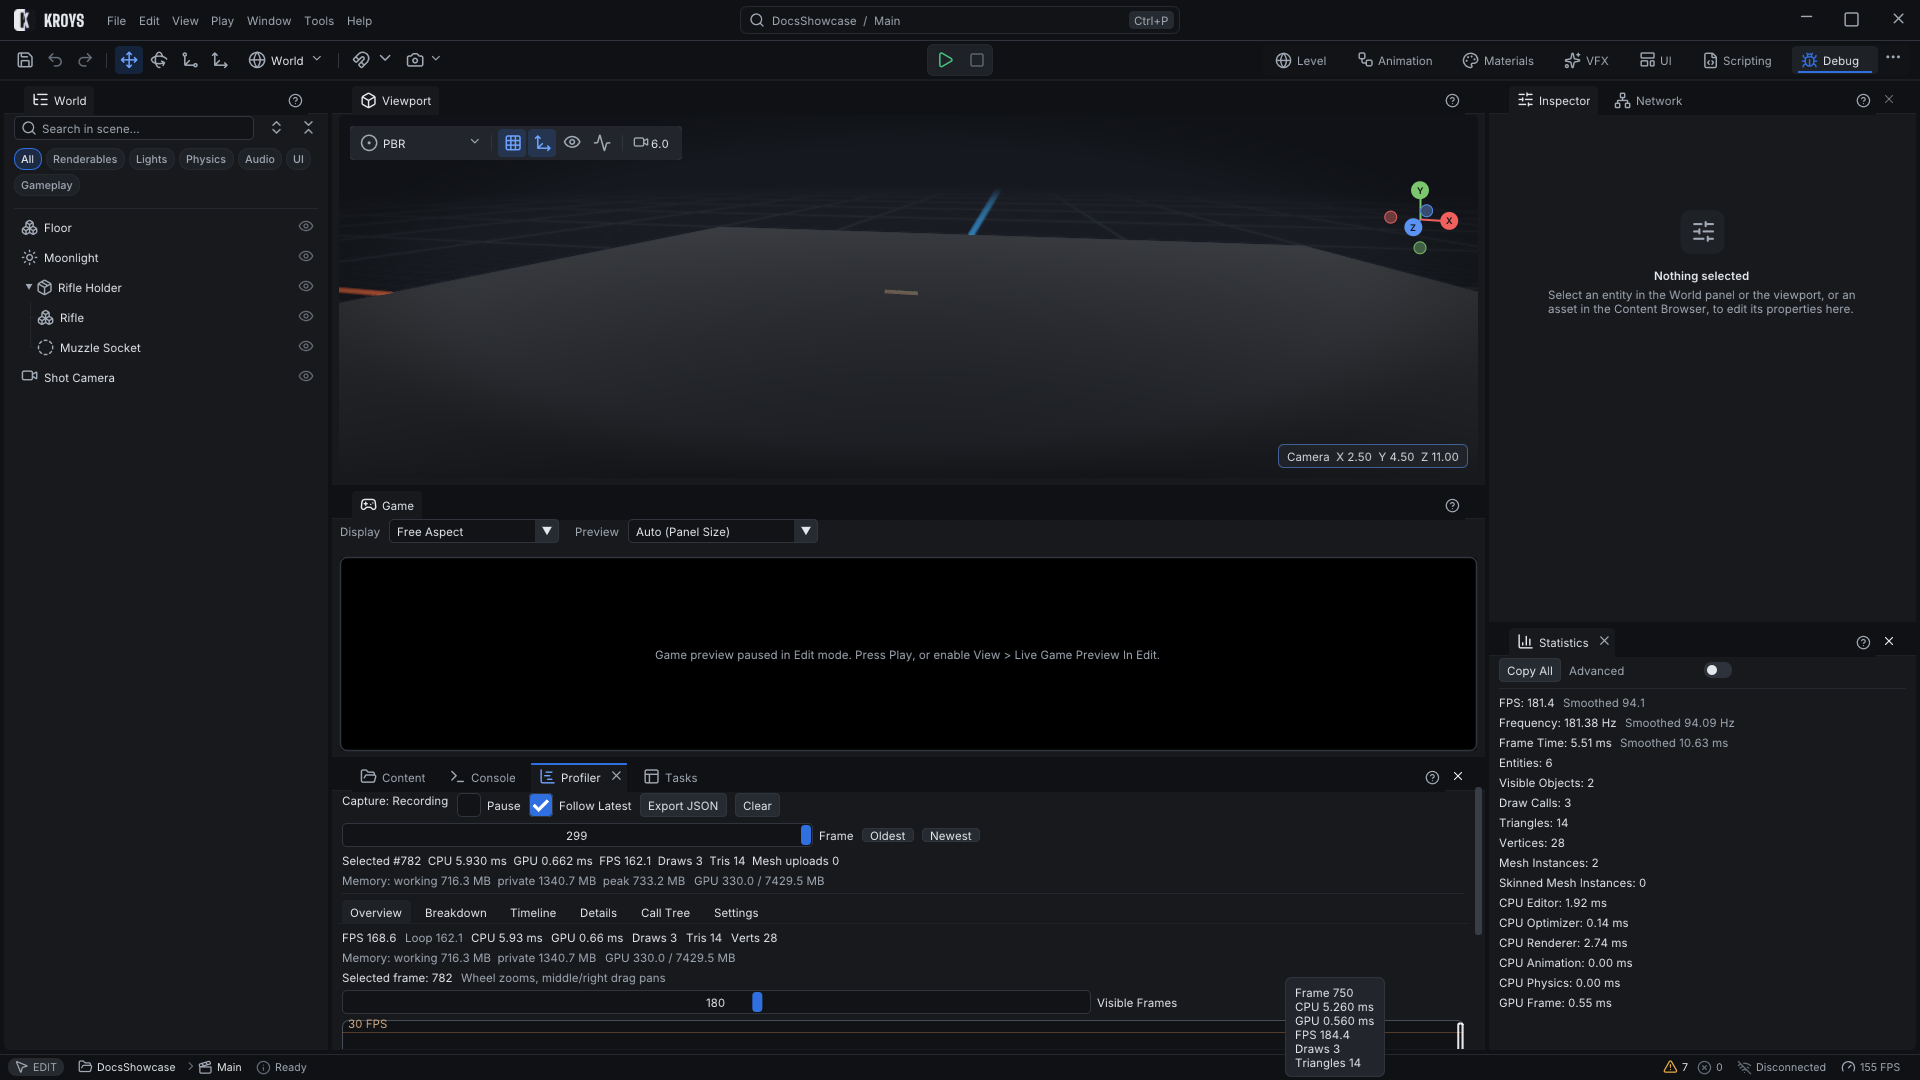
The Debug workspace gathers the panels for finding problems:
- Statistics: frame time, draw counts, memory.
- Profiler: CPU and GPU timings per frame, with a history.
- Network: the local server and client, and their traffic.
- Tasks: background work (imports, script and plugin builds, exports) with progress and cancel.
Undo
Scene edits, asset edits in the authoring editors and plugin commands are undoable: Ctrl+Z and Ctrl+Y. A drag is one step; a plugin command wrapped in a transaction is one step however many entities it changed.
Next: Workspaces.
KroysEngine 0.1.0 documentation, built from the engine repository by Tools/BuildDocsSite.py.